
4. Model monitoring
The system continuously tracks metadata to monitor the performance of the models.
Model metadata
All information about a model is provided through the Model Metadata endpoint. This includes information on:
- Model updates: when the model was last updated
- Data periods: a period in time.
- Model accuracy: The accuracy of the model within a data period
Model updates
The updated_at field contains the timestamp of when the model was last updated.
Data periods
Each period has a type, a start date, an end date, a list of descriptive statistics, and a list of model accuracy metrics. These data periods are defined automatically by Toqua, to represent continuous stretches of stable performance over time; this means unaffected by hull cleanings, drydocking, or long idling periods that might alter performance.
These data periods are present under the field periods. If a period's type is set to benchmark, it refers to the period on which the model was initially trained. If it's set to dynamic, it refers to a period on which the model was retrained afterwards.
Model accuracy
Metrics
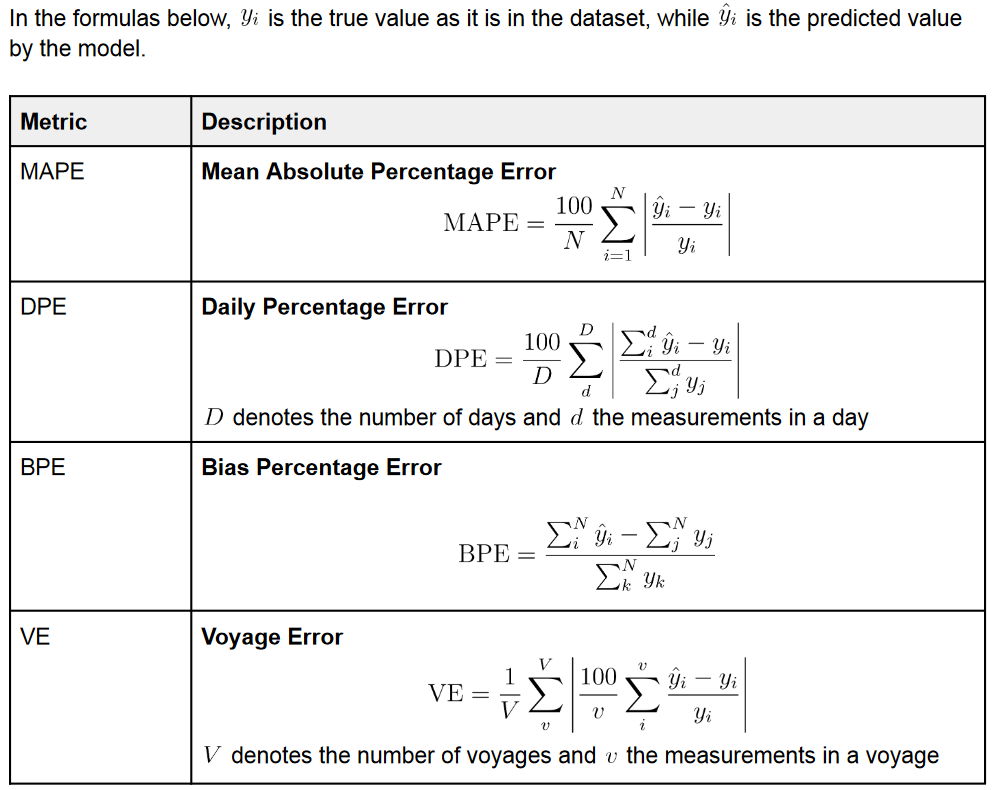
To track how well the models perform, a comprehensive suite of accuracy metrics is available. For a breakdown of how these metrics are calculated, see the Blue Modeling Standard and its accompanying tutorial on Benchmarking Model Accuracy. Some example metrics can be found in the table below.
To illustrate, let's say our model has the following metrics when predicting the fuel consumption starting from the SOG.
| Relation | Mean Absolute Percentage Error (MAPE) | Bias Percentage Error (BPE) |
|---|---|---|
| SOG -> Fuel | 7.5% |
What this means is that:
- On a single data point (e.g. per 5 min), the model's prediction was, on average, off by 7.5%.
- Averaged over all data points, the model's predictions were off by -1.3%
To see how this is different, imagine a scenario where a model alternatingly over/underpredicts by 5%. In the case of BPE, this would result in an average error of 0%. But for MAPE, this results in an error of 5%. MAPE is usually too strict of a metric for most use cases, BPE is often too averaged. In practice, a useful metric is usually the Voyage Error (VE).
Note: unlike other accuracy metrics, the voyage metrics are not available via the Model Metadata endpoint, but via the Voyage Metrics endpoint , where you can also find extra information on the evaluated voyages.
Many Relations
The metrics above are tracked for every possible relation. We keep track of all accuracy metrics between any two parameters that can be modeled. So, as Ship Kernels can model SOG, STW, ME RPM, ME Power and ME Fuel Consumption, we provide accuracy metrics bidirectionally between each of these parameters.
Extending our previous example to multiple metrics could look as follows.
| Relation | MAPE | BPE |
|---|---|---|
| SOG -> Fuel | 7.5% | |
| RPM -> Power | 2.0% | |
| Fuel -> Power | 0.5% | 0.01% |
| .... |
In the metadata endpoint, this is represented as:
{
    "metrics": [
        {
            "entrypoint": "sog",
            "target": "me_fo_consumption",
            "metrics": {
                "mape": 7.5,
                "bpe": -1.3,
                ...
            }
        },
        {
            "entrypoint": "me_rpm",
            "target": "me_power",
            "metrics": {
                "mape": 2.0,
                "bpe": -0.2,
                ...
            }
        },
        {
            "entrypoint": "me_fo_consumption",
            "target": "me_power",
            "metrics": {
                "mape": 0.5,
                "bpe": 0.01,
                ...
            }
        },
        ...
    ],
    ...
}
Dynamic over time
The accuracy metrics above, for all relations, are not available once, but are tracked separately for every different data period. To keep track of the metrics of the model for each period in time it's sufficient to look at the metrics object embedded within each data period.
Extending the previous example further:
| Data Period | Relation | MAPE | BPE |
|---|---|---|---|
| 2023-12-01 to 2024-01-01 | SOG -> Power | 7.5% | |
| 2023-12-01 to 2024-01-01 | RPM -> Power | 2.0% | |
| 2023-12-01 to 2024-01-01 | Fuel -> Power | 0.5% | 0.01% |
| 2024-01-01 to 2024-03-01 | SOG -> Power | 7.3% | |
| 2024-01-01 to 2024-03-01 | RPM -> Power | 1.5% | |
| 2024-01-01 to 2024-03-01 | Fuel -> Power | 0.6% | 0.03% |
Which would be represented as:
{
    "periods": [
        {
            "start_date": "2023-12-01",
            "end_date": "2024-01-01",
            "metrics": [
                {
                    "entrypoint": "sog",
                    "target": "me_fo_consumption",
                    "metrics": {
                        "mape": 7.5,
                        "bpe": -1.3,
                        ...
                    }
                },
                {
                    "entrypoint": "me_rpm",
                    "target": "me_power",
                    "metrics": {
                        "mape": 2.0,
                        "bpe": -0.2,
                        ...
                    }
                },
                {
                    "entrypoint": "me_fo_consumption",
                    "target": "me_power",
                    "metrics": {
                        "mape": 0.5,
                        "bpe": 0.01,
                        ...
                    }
                },
                ...
            ]
        },
        {
            "start_date": "2024-01-01",
            "end_date": "2024-03-01",
            "metrics": [
                {
                    "entrypoint": "sog",
                    "target": "me_fo_consumption",
                    "metrics": {
                        "mape": 7.3,
                        "bpe": -1.1,
                        ...
                    }
                },
                {
                    "entrypoint": "me_rpm",
                    "target": "me_power",
                    "metrics": {
                        "mape": 1.5,
                        "bpe": -0.1,
                        ...
                    }
                },
                {
                    "entrypoint": "me_fo_consumption",
                    "target": "me_power",
                    "metrics": {
                        "mape": 0.6,
                        "bpe": 0.03,
                        ...
                    }
                },
                ...
            ]
        }
    ]
    ...
}
Updated about 1 year ago