
2. Data monitoring
To build a good data-driven model, good data is required. Data quality can differ a lot depending on data source (noon reports vs sensor), sensor type, sensor manufacturer, frequency, etc. Having issues go undetected for longer periods can have far-reaching consequences. To stay on top of this, we continuously monitor data quality and flag issues.
Data Health
Our data health functionality consists of a series of data quality checks, and a series of visualizations. These are generated after newly uploaded data has been processed, so it may take a few hours to appear.
Data Health Checks
We discern four types of checks:
- Availability: Identifies any missing signals that could indicate data collection issues or transmission errors.
- Outliers: Identifies signals that contain values significantly deviating from expected ranges. These outliers may suggest measurement errors or data corruption.
- Cross-signal checks: Identifies inconsistencies between signals that might not be evident when signals are examined in isolation.
- Cross-source checks: Identifies deviations across data sources for the same signal. These may indicate more subtle issues, such as miscalibration or misreporting.
Accompanying each check is a visualization plot showing the raw data over time, together with any issues that were detected.
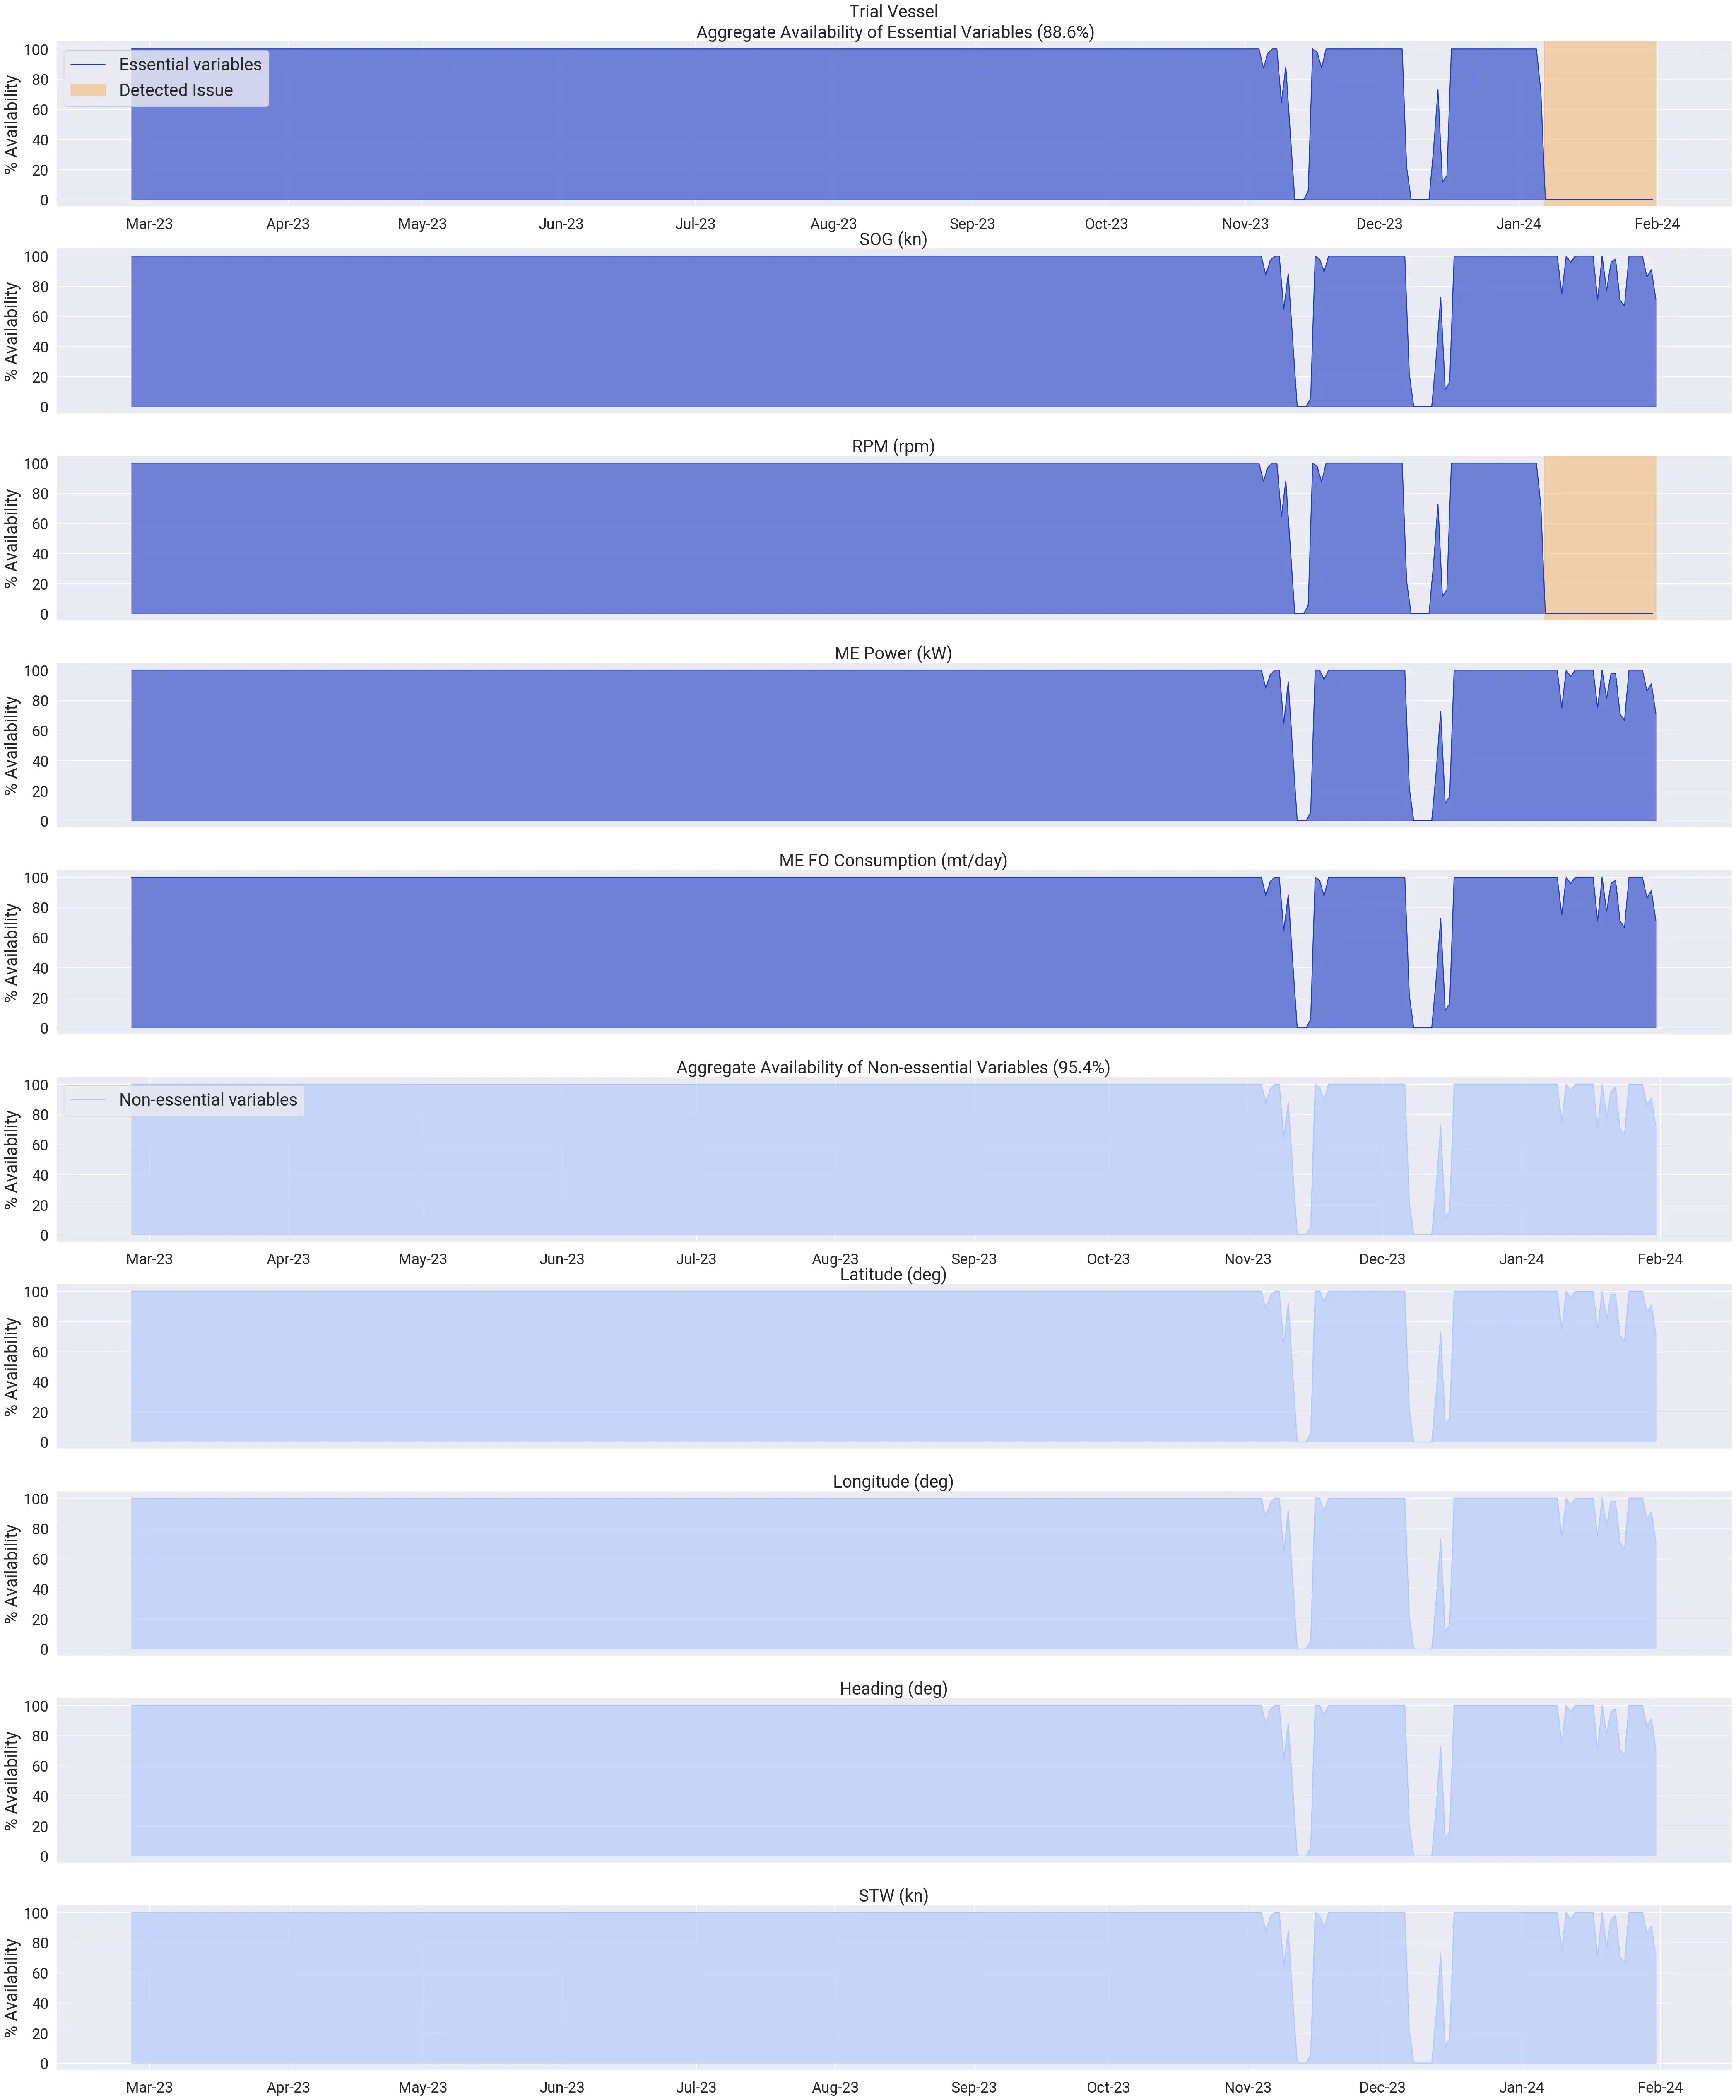
Example
In this example, an availability issue with the RPM sensor has been detected: it hasn't reported data since January 2024.
This visualization and additional information about the detected issue can be retrieved through the Data Health endpoint. This will return a tree structure containing groups, issues and visualizations. Groups are used for grouping multiple issues and visualizations per data source and per data health check.
An example of what the data health endpoint could return is shown below. There are two issues detected. One is the RPM availability issue, hence it is part of the group "availability" and the group "sensor". The other is a cross-source issue, where the SFOC trend has been found to deviate between sensors and noon reports. The issue description will indicate which thresholds were exceeded, pinpointing the specific variables and values.
The visualizations can be retrieved through the URLs.
{
    "id": "root",
    "type": "root",
    "created_at": "2024-01-31T17:02:42.638059",
    "items": [
        {
            "id": "availability",
            "type": "group",
            "title": "Availability",
            "items": [
                {
                    "id": "availability-sensor",
                    "type": "group",
                    "title": "Sensor",
                    "items": [
                        {
                            "id": "availability-sensor-viz",
                            "type": "visualization",
                            "title": "Sensor",
                            "description": "Sensor Availability",
                            "url": "https://example.com/image1"
                        },
                        {
                            "id": "availability-sensor-issue-1",
                            "type": "issue",
                            "level": "warning",
                            "description": "Missing essential variables (ME_RPM). [Jan 06, 2024 - Jan 31, 2024]"
                        }
                    ]
                },
                {
                    "id": "availability-nr",
                    "type": "group",
                    "title": "Noon Report",
                    "items": [
                        {
                            "id": "availability-nr-viz",
                            "type": "visualization",
                            "title": "Noon Report",
                            "description": "Noon Report Availability",
                            "url": "https://example.com/image2"
                        }
                    ]
                }
            ]
        },
        {
            "id": "cross-source",
            "type": "group",
            "title": "Trends",
            "items": [
                {
                    "id": "trends-viz",
                    "type": "visualization",
                    "title": "Trends",
                    "description": "Trends",
                    "url": "https://example.com/image3"
                },
                {
                    "id": "trends-issue-1",
                    "type": "issue",
                    "level": "warning",
                    "description": "SFOC deviation of 6.5% between sensor data and noon reports. [Jan 22, 2024 - Jan 31, 2024]"
                }
            ]
        }
    ]
}
Updated over 1 year ago