
Paint Performance Analysis
Toqua's API can be used to analyze paint performance over dry-dock cycles for a full fleet. This helps compare performance of different paint types, as well as set expectations for expected average performance deterioration over a drydocking cycle across the fleet.
How to run this?
Go here to instantly run all code below inside of your browser.
Use Case
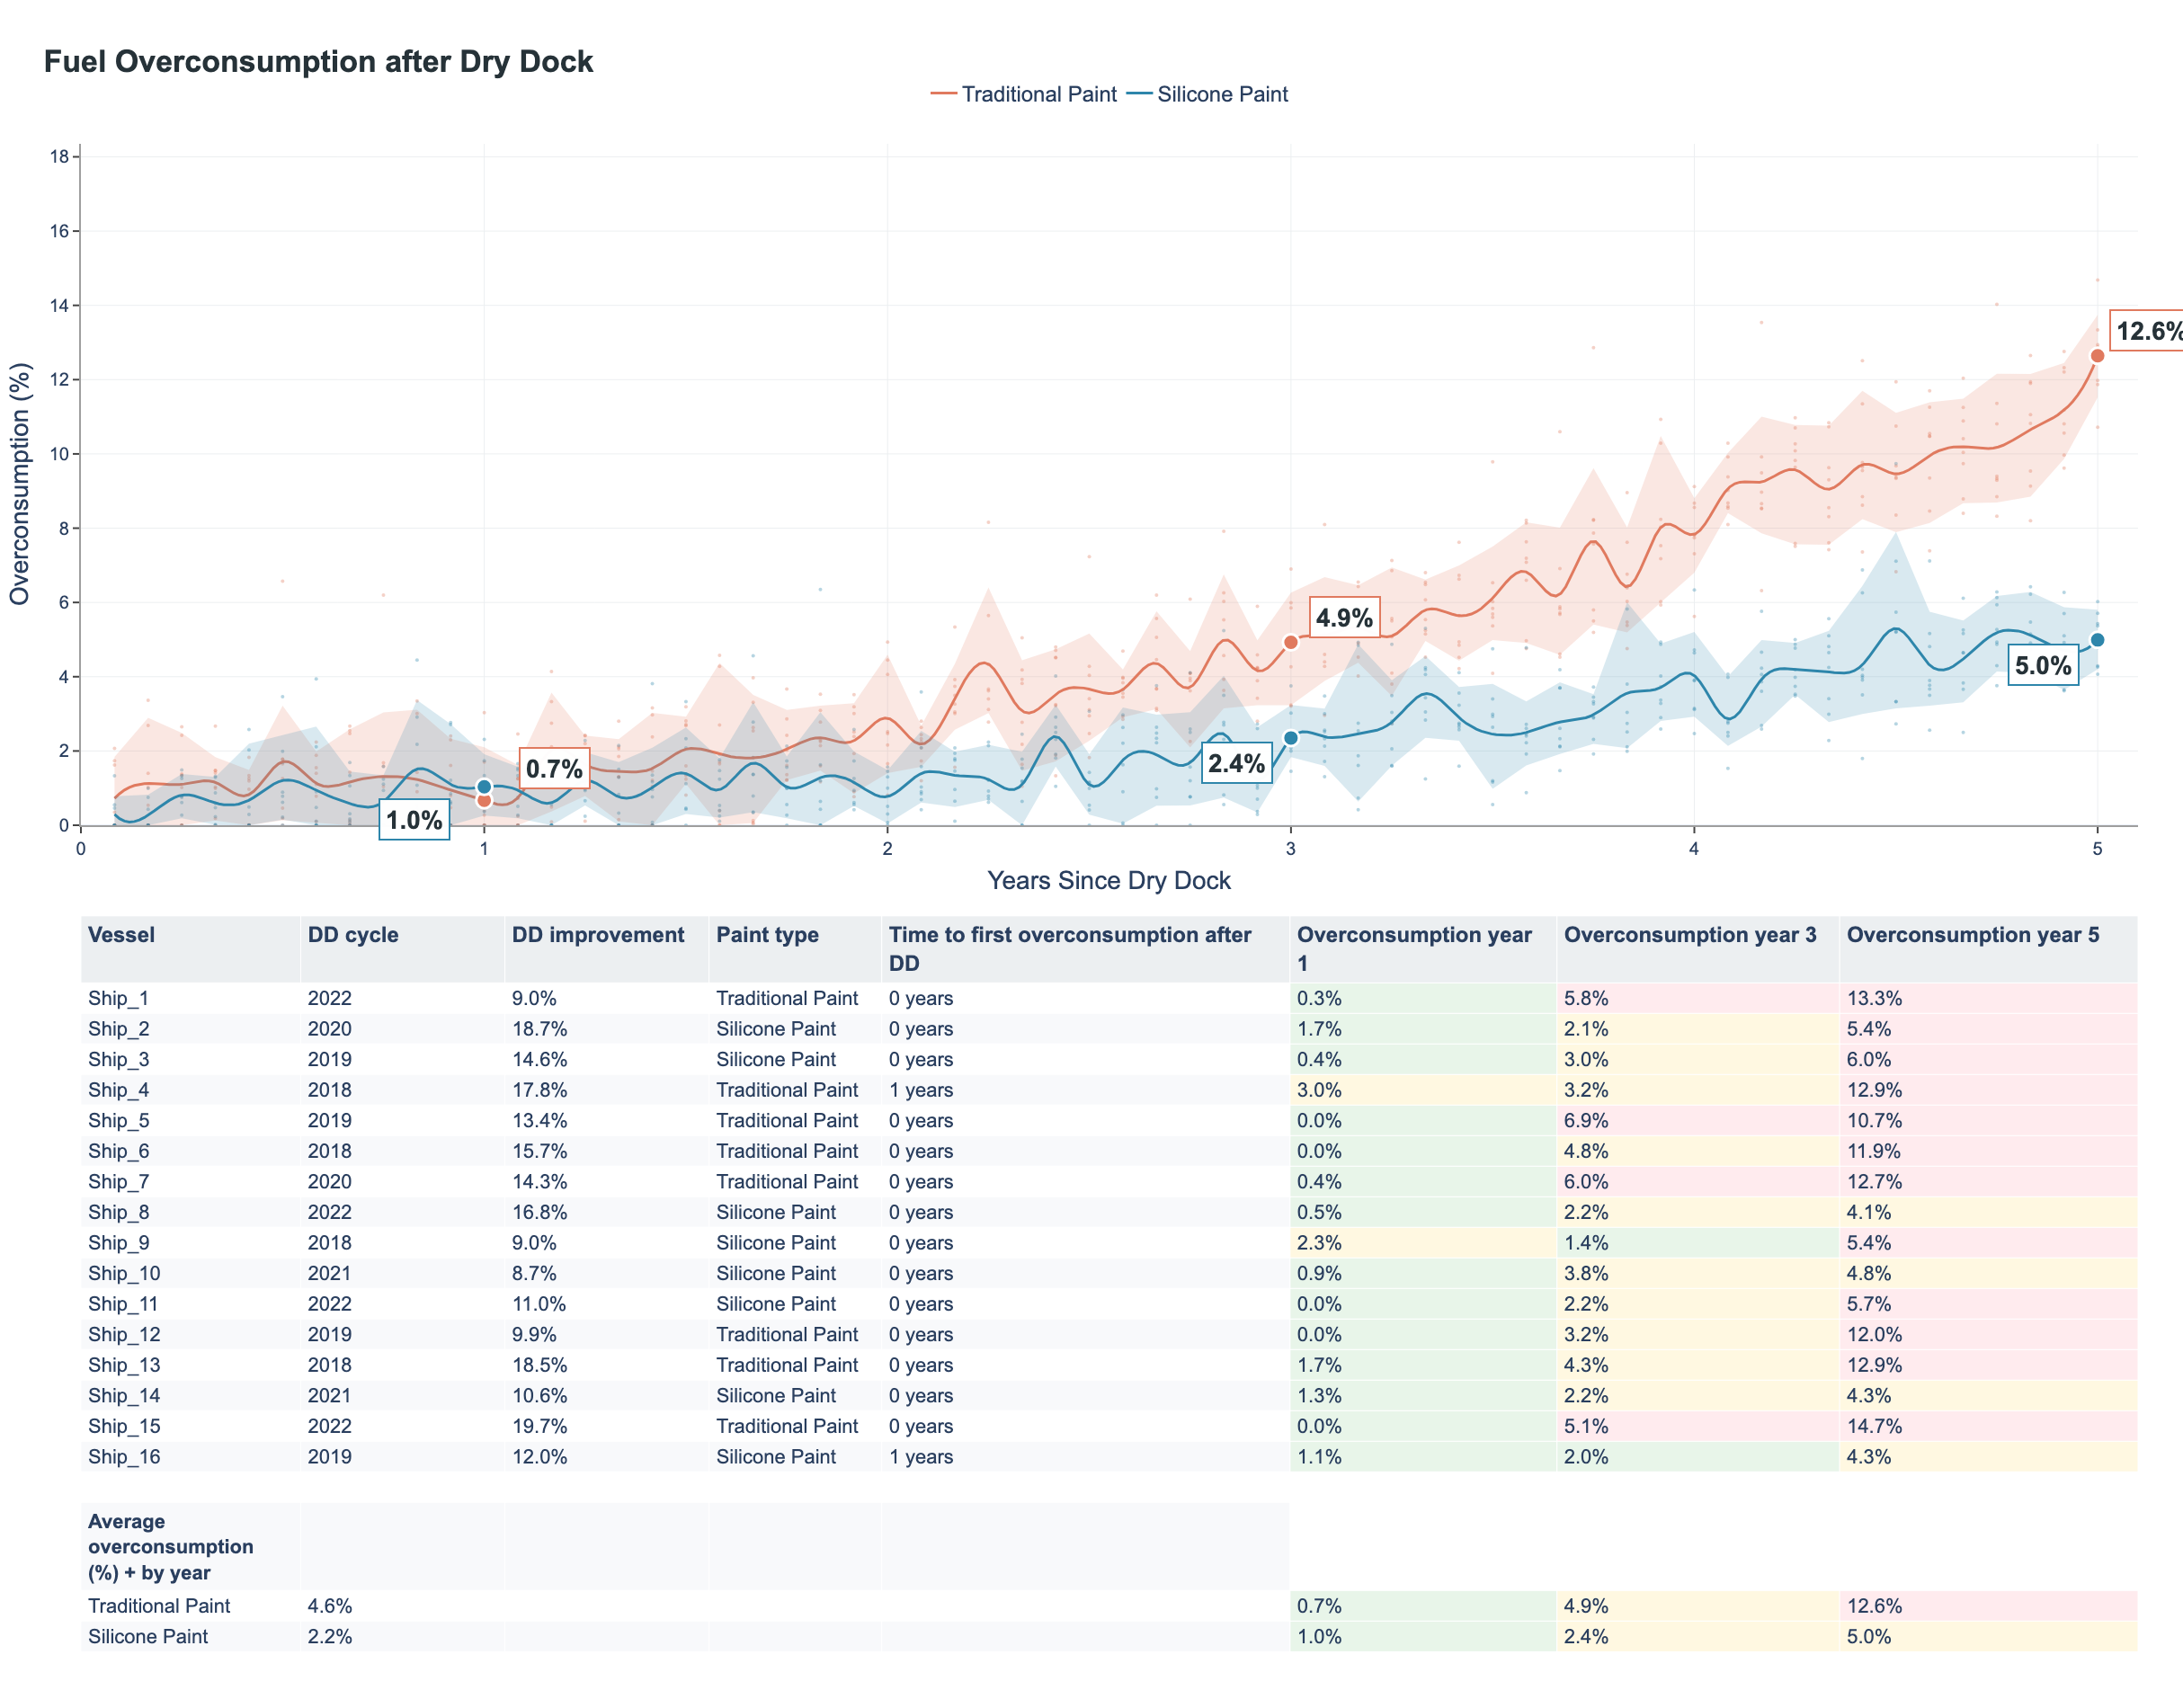
In this use case we'll be leveraging the performance endpoints to analyze the performance of different paint types for a full fleet. The goal is to create a visualization as follows.
Fill in your API key below
API_KEY = "your-api-key"Helper functions
Some helper functions to not clutter our code too much later on.
import json
import requests
import requests
import pandas as pd
import numpy as np
from plotly.subplots import make_subplots
import plotly.graph_objects as go
from scipy.interpolate import make_interp_spline
import statsmodels.api as sm

# Configuration
BASE_URL = "https://api.toqua.ai"
HEADERS = {
    "accept": "application/json",
    "X-API-Key": API_KEY
}

# Helper Functions
def get_vessels():
    print("🔍 Fetching vessels.")
    url = f"{BASE_URL}/ships/"
    res = requests.get(url, headers=HEADERS)
    res.raise_for_status()
    data = res.json()
    ships = data["ships"] if isinstance(data, dict) and "ships" in data else data
    return ships

def get_performance(imo):
    url = f"{BASE_URL}/performance/{imo}"
    try:
        res = requests.get(url, headers=HEADERS)
        res.raise_for_status()
        return res.json()
    except requests.exceptions.HTTPError as e:
        print(f"⚠️  Skipping IMO {imo} – performance not found ({e})")
        return {}

def to_naive_datetime(dt_like_or_list):
    """Convert API datetime(s) to naive pandas timestamps (UTC->naive)."""
    return pd.to_datetime(dt_like_or_list, utc=True).tz_convert(None)

# Main Logic
performance_per_dry_dock_cycle = []
df_performance_per_period = []  # collect dict rows; we convert to DataFrame once at the end

vessels = get_vessels()
vessels = sorted([v for v in vessels if v.get("name")], key=lambda v: v["name"])
print(f"🚢 Found {len(vessels)} vessel(s)")
2. Process each vessel's data
For each vessel, we retrieve the performance over time and the vessel's events from the Toqua API.
The performance over time is segmented into periods of stable performance. For each period we keep track of the time since last dry dock and the overconsumption since then. In parallel, we also keep track of the yearly overconsumption increase per dry dock cycle.
That should give us the following tables:
Table 1: Performance per period since last dry dock
| vessel | imo | paint_type | dry_dock_date | date | months_since_dd | overconsumption |
|---|---|---|---|---|---|---|
| Ship_A | 1000001 | Traditional | 2023-01-15 | 2023-02-15 08:00:00 | 1.0 | 0.0 |
| Ship_A | 1000001 | Traditional | 2023-01-15 | 2023-06-15 08:00:00 | 5.0 | 2.2 |
| Ship_B | 1000002 | Silicone | 2023-03-01 | 2023-04-01 10:00:00 | 1.0 | 0.0 |
| Ship_B | 1000002 | Silicone | 2023-03-01 | 2023-12-01 10:00:00 | 9.0 | 2.3 |
| Ship_C | 1000003 | Traditional | 2022-11-10 | 2023-01-10 07:00:00 | 2.0 | 0.3 |
| Ship_C | 1000003 | Traditional | 2022-11-10 | 2024-01-10 07:00:00 | 14.0 | 11.9 |
| ... | ... | ... | ... | ... | ... | ... |
Table 2: Performance per dry dock cycle per year
| Vessel | DD cycle | DD improvement | Paint type | Time to first overconsumption after DD | Overconsumption year 1 | Overconsumption year 3 | Overconsumption year 5 |
|---|---|---|---|---|---|---|---|
| Ship_A | 2023 | 9.5% | Traditional | 0 years | 0.4% | 5.9% | 13.2% |
| Ship_B | 2022 | 17.8% | Silicone | 0 years | 1.8% | 2.4% | 5.0% |
| Ship_C | 2021 | 15.3% | Traditional | 1 year | 3.1% | 6.2% | 12.5% |
| Ship_D | 2023 | 13.7% | Traditional | 0 years | 0.0% | 4.6% | 11.1% |
| Ship_E | 2022 | 16.1% | Silicone | 0 years | 0.9% | 3.3% | 4.8% |
| Ship_F | 2021 | 10.8% | Traditional | 0 years | 0.2% | 5.2% | 14.3% |
| ... | ... | ... | ... | ... | ... | ... | ... |
for vessel in vessels:
    imo = vessel.get("imo_number") or vessel.get("imo")
    name = vessel.get("name")
    print(f"\n🔍 Processing vessel: {name} (IMO {imo})")

    perf_data = get_performance(imo)
    if not perf_data:
        continue

    events = perf_data.get("events", {}) or {}
    perf = perf_data.get("performance_over_time", {}) or {}

    # Skip if incomplete
    if not events or not perf:
        print("⚠️  Missing events or performance data")
        continue

    # Build performance frame (keep 'calibrated' to match your version)
    df_perf = pd.DataFrame({
        "datetime_start": to_naive_datetime(perf["datetime_start"]),
        "datetime_end":   to_naive_datetime(perf["datetime_end"]),
        "observed_excess": perf["calibrated_excess_fuel_consumption_percentage"]
    }).sort_values("datetime_start")

    # Parse dry dock events (normalize label variants) using same datetime parsing
    dd_events = []
    types  = events.get("type", []) or []
    starts = events.get("datetime_start", []) or []
    ends   = events.get("datetime_end", []) or []
    paints = events.get("paint_type", []) or []
    descs  = events.get("description", []) or []

    for i, typ in enumerate(types):
        if not typ == "dry_dock":
          continue
        try:
            start = to_naive_datetime(starts[i])
            end   = to_naive_datetime(ends[i])
            if pd.isna(start) or pd.isna(end):
                continue

            paint = paints[i] if i < len(paints) and paints[i] else "Unknown"
            desc  = descs[i] if i < len(descs) else ""

            dd_events.append({
                "start": start,
                "end": end,
                "paint_type": paint,
                "description": desc
            })
        except Exception:
            continue

    dd_events = sorted(dd_events, key=lambda x: x["start"])
    print(f"📅 Found {len(dd_events)} dry dock(s): {[d['start'] for d in dd_events]}")

    # Per dry-dock cycle (INSIDE vessel loop)
    for i, dd in enumerate(dd_events):
        start_dd, end_dd = dd["start"], dd["end"]
        paint_type = dd.get("paint_type") or "Unknown"
        next_dd = dd_events[i + 1]["start"] if i + 1 < len(dd_events) else pd.Timestamp.max

        # Windows for this cycle (clip at next DD)
        before = df_perf[df_perf["datetime_end"] <= start_dd]
        after = df_perf[
            (df_perf["datetime_start"] >= end_dd) &
            (df_perf["datetime_start"] <  next_dd)
        ].sort_values("datetime_start").copy()

        # Always add a table row; plot only if we have 'after'
        if after.empty:
            performance_per_dry_dock_cycle.append({
                "vessel": name,
                "imo": imo,
                "dry_dock_date": end_dd,
                "paint_type": paint_type,
                "overcons_before": (before.iloc[-1]["observed_excess"] if not before.empty else np.nan),
                "overcons_after": np.nan,
                "improvement": np.nan,
                "time_to_first_oc": "N/A",
                "month_4": None,
                "month_8": None,
                "month_12": None
            })
            continue

        # Baseline for this cycle = first point after dry dock
        after_val = after.iloc[0]["observed_excess"]

        # Add all post-DD points (until next DD) for plotting (baseline-relative)
        for _, row in after.iterrows():
            months_since_dd = (row["datetime_start"] - end_dd).days / 30.44
            if months_since_dd >= 0:
                df_performance_per_period.append({
                    "vessel": name,
                    "imo": imo,
                    "paint_type": paint_type,
                    "dry_dock_date": end_dd,
                    "date": row["datetime_start"],
                    "months_since_dd": months_since_dd,
                    "overconsumption": row["observed_excess"] - after_val
                })

        # AFTER-BASED METRICS (do not require 'before')
        tolerance = 0.9
        mask = after["observed_excess"] > (after_val + tolerance)
        time_to_first = "N/A"
        if mask.any():
            first_time = after.loc[mask, "datetime_start"].iloc[0]
            months = int((first_time - end_dd).days // 30)
            time_to_first = f"{months} months"

        # 1/3/5-year deltas (12/36/60 months), only before next dry dock
        future_points = {}
        for yr in (1, 3, 5):
            future_date = end_dd + pd.DateOffset(months=12 * yr)
            if future_date >= next_dd:
                continue
            after["date_diff"] = (after["datetime_start"] - future_date).abs()
            closest_row = after.sort_values("date_diff").head(1)
            if not closest_row.empty:
                actual_val = float(closest_row.iloc[0]["observed_excess"])
                future_points[f"year_{yr}"] = actual_val - after_val
        after.drop(columns="date_diff", inplace=True, errors="ignore")

        # BRANCH ON 'before'
        if before.empty:
            performance_per_dry_dock_cycle.append({
                "vessel": name,
                "imo": imo,
                "dry_dock_date": end_dd,
                "paint_type": paint_type,
                "overcons_before": np.nan,
                "overcons_after": after_val,
                "improvement": np.nan,
                "time_to_first_oc": time_to_first,
                "year_1": future_points.get("year_1"),
                "year_3": future_points.get("year_3"),
                "year_5": future_points.get("year_5"),
            })
            continue

        # With 'before' → also compute improvement
        before_val = before.iloc[-1]["observed_excess"]
        improvement = before_val - after_val

        performance_per_dry_dock_cycle.append({
            "vessel": name,
            "imo": imo,
            "dry_dock_date": end_dd,
            "paint_type": paint_type,
            "overcons_before": before_val,
            "overcons_after": after_val,
            "improvement": improvement,
            "time_to_first_oc": time_to_first,
            **future_points
        })

print("✅ Processing complete.")
3. Visualize Results
Next we visualize the results using Plotly to create an interactive chart and table.
# =========================
# Visualisation
# =========================
import numpy as np
import pandas as pd
from plotly.subplots import make_subplots
import plotly.graph_objects as go

# If df_all/results already exist, this re-wrap keeps column order stable
df_performance_per_period = pd.DataFrame(
    df_performance_per_period,
    columns=["vessel","imo","paint_type","dry_dock_date","date","months_since_dd","overconsumption"]
)
df_results = pd.DataFrame(performance_per_dry_dock_cycle)

# -----------------------
# Helpers
# -----------------------
def format_pct(val):
    if val is None or val == "N/A" or (isinstance(val, float) and np.isnan(val)):
        return "N/A"
    if abs(val) < 0.05:
        return "0.0%"
    return f"{val:.1f}%"

def hex_to_rgba_str(hex_color, alpha=0.2):
    """'#RRGGBB' -> 'rgba(r,g,b,a)'"""
    h = (hex_color or "#666").lstrip("#")
    if len(h) == 3:
        h = "".join(c*2 for c in h)
    r, g, b = int(h[0:2],16), int(h[2:4],16), int(h[4:6],16)
    return f"rgba({r},{g},{b},{alpha})"

# -----------------------
# Build the event table rows from results (Year 1/3/5 only)
# -----------------------
event_rows = []
for r in performance_per_dry_dock_cycle:
    dd_cycle = r["dry_dock_date"].strftime("%Y-%m") if isinstance(r["dry_dock_date"], pd.Timestamp) else "N/A"
    event_rows.append([
        r['vessel'],
        dd_cycle,
        format_pct(r.get('improvement')),
        r.get('paint_type', 'Unknown'),
        r.get('time_to_first_oc', 'N/A'),
        format_pct(r.get('year_1')),
        format_pct(r.get('year_3')),
        format_pct(r.get('year_5'))
    ])

event_df = pd.DataFrame(event_rows, columns=[
    "Vessel", "DD cycle", "DD improvement", "Paint type",
    "Time to first overconsumption after DD",
    "Overconsumption year 1", "Overconsumption year 3", "Overconsumption year 5"
])

# -----------------------
# Normalize paints & dynamic colors
# -----------------------
if not df_performance_per_period.empty:
    df_performance_per_period["paint_type"] = (
        df_performance_per_period["paint_type"].fillna("Unknown").astype(str).str.strip().replace({"": "Unknown"})
    )
    unique_paints = df_performance_per_period["paint_type"].unique().tolist()
else:
    unique_paints = []

# keep 'Unknown' at the end
if "Unknown" in unique_paints:
    unique_paints = [p for p in unique_paints if p != "Unknown"] + ["Unknown"]

palette = [
    "#1f77b4", "#d62728", "#2ca02c", "#9467bd", "#8c564b",
    "#e377c2", "#7f7f7f", "#bcbd22", "#17becf", "#ff7f0e"
]
color_map = {p: palette[i % len(palette)] for i, p in enumerate(unique_paints)}

# -----------------------
# Consolidated averages (append to table)
# -----------------------
if not df_performance_per_period.empty:
    paint_means = df_performance_per_period.groupby("paint_type", as_index=False)["overconsumption"].mean()
    paint_means["__is_unknown"] = (paint_means["paint_type"] == "Unknown")
    paint_means = paint_means.sort_values(["__is_unknown", "paint_type"]).drop(columns="__is_unknown")

    def _nanmean_from_results(key):
        vals = []
        for rr in performance_per_dry_dock_cycle:
            v = rr.get(key)
            if isinstance(v, (int, float)) and not np.isnan(v):
                vals.append(v)
        return float(np.mean(vals)) if vals else np.nan

    avg_y1 = _nanmean_from_results("year_1")
    avg_y3 = _nanmean_from_results("year_3")
    avg_y5 = _nanmean_from_results("year_5")

    avg_rows = []
    avg_rows.append({c: "" for c in event_df.columns})  # blank separator
    avg_rows.append({
        "Vessel": "<b>Average overconsumption (%) + by year</b>",
        "DD cycle": "", "DD improvement": "", "Paint type": "",
        "Time to first overconsumption after DD": "",
        "Overconsumption year 1": "", "Overconsumption year 3": "", "Overconsumption year 5": "",
    })
    first = True
    for _, rmean in paint_means.iterrows():
        avg_rows.append({
            "Vessel": rmean["paint_type"],
            "DD cycle": format_pct(rmean["overconsumption"]),
            "DD improvement": "",
            "Paint type": "",
            "Time to first overconsumption after DD": "",
            "Overconsumption year 1": format_pct(avg_y1) if first else "",
            "Overconsumption year 3": format_pct(avg_y3) if first else "",
            "Overconsumption year 5": format_pct(avg_y5) if first else "",
        })
        first = False

    event_df = pd.concat([event_df, pd.DataFrame(avg_rows)], ignore_index=True)

# -----------------------
# Size & typography knobs
# -----------------------
FIG_HEIGHT = 1850
ROW_HEIGHTS = [0.45, 0.45, 0.10]   # scatter / main table / averages table

BASE_FONT = 16
TITLE_FONT = 32
SUBTITLE_SIZE = 15
AXIS_TITLE_SIZE = 24
TICK_FONT_SIZE = 16
LEGEND_FONT_SIZE = 20
HOVER_FONT_SIZE = 14

TABLE_HEADER_SIZE = 18
TABLE_CELL_SIZE = 16
TABLE_HEADER_HEIGHT = 40
TABLE_CELL_HEIGHT = 30
AVG_TABLE_CELL_SIZE = 18

# --- Year-label knobs (for the small boxes) ---
MEAN_MARKER_SIZE   = 18      # halo marker size at Y1/Y3/Y5
LABEL_FONT_SIZE    = 24      # text inside the small boxes
LABEL_BORDERPAD    = 6       # padding inside the box
LABEL_TINT_ALPHA   = 0.16    # background tint strength
CLOSE_THRESH       = 0.8     # %-pt distance to treat two paints as "close"

# -----------------------
# Split table into main vs averages block
# -----------------------
avg_idx = np.where(event_df["Vessel"].astype(str).str.contains(
    "Average overconsumption", case=False, regex=False
).to_numpy())[0]

if len(avg_idx):
    split_at = avg_idx[0]
    main_df = event_df.iloc[:split_at].copy()
    averages_df = event_df.iloc[split_at:].copy()
else:
    main_df = event_df.copy()
    averages_df = event_df.iloc[0:0].copy()

# -----------------------
# Plotly Figure (3 rows: scatter + main table + big averages table)
# -----------------------
fig = make_subplots(
    rows=3, cols=1,
    row_heights=ROW_HEIGHTS,
    vertical_spacing=0.06,
    specs=[[{"type": "scatter"}],
           [{"type": "table"}],
           [{"type": "table"}]]
)

# 1) Trend LINES FIRST (Lowess), so points/labels sit on top
if not df_performance_per_period.empty:
    try:
        import statsmodels.api as sm
        LOWESS_FRAC = 0.25
        for paint in unique_paints:
            sub = df_performance_per_period[df_performance_per_period["paint_type"] == paint].copy().sort_values("months_since_dd")
            if sub.empty:
                continue
            x_years = (sub["months_since_dd"] / 12).to_numpy()
            y_vals  = sub["overconsumption"].to_numpy()
            if len(x_years) >= 5 and np.isfinite(y_vals).sum() >= 5:
                smoothed = sm.nonparametric.lowess(y_vals, x_years, frac=LOWESS_FRAC, return_sorted=True)
                x_fit, y_fit = smoothed[:, 0], smoothed[:, 1]
                fig.add_trace(go.Scatter(
                    x=x_fit, y=y_fit, mode="lines", name=paint,
                    line=dict(color=color_map.get(paint, "#888"), width=3),
                    legendgroup=paint, showlegend=True
                ), row=1, col=1)
    except Exception as e:
        print("LOWESS failed/skipped:", e)

    # 2) POINTS ON TOP
    for paint in unique_paints:
        sub = df_performance_per_period[df_performance_per_period["paint_type"] == paint].copy().sort_values("months_since_dd")
        if sub.empty:
            continue
        fig.add_trace(go.Scatter(
            x=sub["months_since_dd"] / 12,
            y=sub["overconsumption"],
            mode="markers",
            marker=dict(color=color_map.get(paint, "#888"), size=7, opacity=0.6,
                        line=dict(width=0.8, color="white")),
            legendgroup=paint, showlegend=False,
            customdata=np.c_[sub["vessel"]],
            hovertemplate=("Vessel: %{customdata[0]}<br>"
                           "Years since DD: %{x:.2f}<br>"
                           "Overcons.: %{y:.1f}%<extra></extra>"),
        ), row=1, col=1)

# -----------------------
# 3) Small boxes at Y1/Y3/Y5 (no arrows, no alerts, anti-overlap)
# -----------------------
months_map = {1: 12, 3: 36, 5: 60}
paint_short = {"Silicone": "Si", "Traditional": "Tr", "Unknown": "Unk"}

def mean_at_month(df, paint, month_target, tol=0.6):
    m = df[
        (df["paint_type"] == paint) &
        (np.isfinite(df["overconsumption"])) &
        (np.isfinite(df["months_since_dd"])) &
        (np.abs(df["months_since_dd"] - month_target) <= tol)
    ]["overconsumption"]
    return float(m.mean()) if len(m) else np.nan

# Base shifts: alternate paints up-left vs down-right
base_shift = {
    0: {"xshift": -70, "yshift": -32, "xanchor": "right"},
    1: {"xshift":  70, "yshift":  32, "xanchor": "left"},
}

for idx, paint in enumerate(unique_paints):
    # If you don't want labels for Unknown, uncomment:
    # if paint == "Unknown": continue

    # Collect mean values at 1/3/5 years
    pts = []
    for yr, mon in months_map.items():
        val = mean_at_month(df_performance_per_period, paint, mon)
        if np.isfinite(val):
            pts.append((yr, val))
    if not pts:
        continue

    # Emphasize the exact points with bigger halo markers
    fig.add_trace(go.Scatter(
        x=[p[0] for p in pts],
        y=[p[1] for p in pts],
        mode="markers",
        marker=dict(
            color=color_map.get(paint, "#666"),
            size=MEAN_MARKER_SIZE,
            line=dict(color="#FFFFFF", width=3)
        ),
        hovertemplate=f"{paint} mean at %{{x}}y: %{{y:.1f}}%<extra></extra>",
        showlegend=False,
        legendgroup=paint
    ), row=1, col=1)

    # Add clean little boxes (no arrows), tinted by paint, shifted to avoid overlap
    for (xv, yv) in pts:
        # check closeness to the closest other paint at same year
        close_to_other = False
        for other in unique_paints:
            if other == paint:
                continue
            ov = mean_at_month(df_performance_per_period, other, months_map[xv])
            if np.isfinite(ov) and abs(ov - yv) < CLOSE_THRESH:
                close_to_other = True
                break

        sty = base_shift.get(idx % 2, {"xshift": -60, "yshift": -28, "xanchor": "right"}).copy()
        if close_to_other:
            sty["xshift"] = int(sty["xshift"] * 1.35)
            sty["yshift"] = int(sty["yshift"] * 1.35)

        fig.add_annotation(
            x=xv, y=yv, xref="x", yref="y",
            text=f"<b>{paint_short.get(paint, paint[:2])} {yv:.1f}%</b>",
            showarrow=False,
            xshift=sty["xshift"], yshift=sty["yshift"], xanchor=sty["xanchor"],
            bgcolor=hex_to_rgba_str(color_map.get(paint, "#666"), LABEL_TINT_ALPHA),
            bordercolor=color_map.get(paint, "#666"),
            borderwidth=2,
            borderpad=LABEL_BORDERPAD,
            font=dict(size=LABEL_FONT_SIZE, color="#263238"),
            align="center",
            row=1, col=1
        )

# -----------------------
# Tables
# -----------------------
y_cols = ["Overconsumption year 1", "Overconsumption year 3", "Overconsumption year 5"]
def cell_bg(v):
    try:
        val = float(str(v).replace("%", ""))
    except:
        return "#FFFFFF"
    if val <= 2:  return "#E8F5E9"
    if val <= 5:  return "#FFF8E1"
    return "#FFEBEE"

# Main table
if not main_df.empty:
    fill_colors_main = []
    for col in main_df.columns:
        col_colors = []
        for i, v in enumerate(main_df[col]):
            if col in y_cols:
                col_colors.append(cell_bg(v))
            else:
                col_colors.append("#FFFFFF" if i % 2 == 0 else "#F8F9FB")
        fill_colors_main.append(col_colors)

    fig.add_trace(go.Table(
        columnwidth=[140, 130, 130, 110, 260, 170, 180, 190],
        header=dict(
            values=[f"<b>{c}</b>" for c in main_df.columns],
            fill_color="#ECEFF1",
            align="left",
            height=TABLE_HEADER_HEIGHT,
            font=dict(size=TABLE_HEADER_SIZE)
        ),
        cells=dict(
            values=[main_df[c] for c in main_df.columns],
            align="left",
            height=TABLE_CELL_HEIGHT,
            fill_color=fill_colors_main,
            font=dict(size=TABLE_CELL_SIZE)
        )
    ), row=2, col=1)

# Averages table (bigger font)
if not averages_df.empty:
    avg_header_mask_local = averages_df["Vessel"].astype(str).str.contains(
        "Average overconsumption", case=False, regex=False
    ).fillna(False)
    averages_df.loc[avg_header_mask_local, "Vessel"] = "<b>Average overconsumption (%) + by year</b>"

    fill_colors_avg = []
    for col in averages_df.columns:
        col_colors = []
        for i, v in enumerate(averages_df[col]):
            if avg_header_mask_local.iat[i]:
                col_colors.append("#F5F7FA")
            elif col in y_cols:
                col_colors.append(cell_bg(v))
            else:
                col_colors.append("#FFFFFF" if i % 2 == 0 else "#F8F9FB")
        fill_colors_avg.append(col_colors)

    fig.add_trace(go.Table(
        columnwidth=[140, 130, 130, 110, 260, 170, 180, 190],
        header=dict(values=[""] * len(averages_df.columns),
                    fill_color="#FFFFFF", align="left", height=10, font=dict(size=1)),
        cells=dict(
            values=[averages_df[c] for c in averages_df.columns],
            align="left",
            height=TABLE_CELL_HEIGHT,
            fill_color=fill_colors_avg,
            font=dict(size=AVG_TABLE_CELL_SIZE)
        )
    ), row=3, col=1)

# Pack ONLY the two tables so they touch
table_indices = [i for i, t in enumerate(fig.data) if getattr(t, "type", "") == "table"]
if len(table_indices) >= 2:
    main_tbl = fig.data[table_indices[0]]
    avg_tbl  = fig.data[table_indices[1]]
    main_bottom = main_tbl.domain.y[0]
    avg_height  = avg_tbl.domain.y[1] - avg_tbl.domain.y[0]
    new_y1 = main_bottom
    new_y0 = max(0.0, new_y1 - avg_height)
    avg_tbl.domain.y = [new_y0, new_y1]

# -----------------------
# Layout & axes (no alert lines/guides)
# -----------------------
fig.update_layout(
    height=FIG_HEIGHT,
    margin=dict(t=150, r=40, b=10, l=80),
    template="plotly_white",
    font=dict(family="Inter, Arial, sans-serif", size=BASE_FONT),
    title=dict(
        text=(
            "<b>Fuel Overconsumption after Dry Dock</b>"
            f"<br><span style='font-size:{SUBTITLE_SIZE}px;color:#546E7A'></span>"
        ),
        x=0.02, xanchor="left",
        font=dict(size=TITLE_FONT, color="#263238"),
        pad=dict(t=10, b=0, l=0, r=0),
    ),
    legend=dict(
        orientation="h", yanchor="bottom", y=1.02,
        xanchor="center", x=0.5, bgcolor="rgba(255,255,255,0.7)",
        font=dict(size=LEGEND_FONT_SIZE)
    ),
    hoverlabel=dict(font=dict(size=HOVER_FONT_SIZE))
)

# Title banner (optional)
try:
    fig.add_shape(
        type="rect",
        xref="paper", x0=0, x1=1,
        yref="paper", y0=1.00, y1=1.10,
        line=dict(width=0),
        fillcolor="#F5F7FA",
        opacity=1
    )
except Exception as e:
    print("Skipping title banner:", e)

# Bigger, clearer axes
fig.update_xaxes(
    title_text="Years Since Dry Dock",
    tick0=0, dtick=1, range=[0, 5.1],
    ticks="outside", ticklen=6, tickwidth=1.5,
    title_font=dict(size=AXIS_TITLE_SIZE),
    tickfont=dict(size=TICK_FONT_SIZE),
    showline=True, linewidth=1.5, linecolor="#9E9E9E",
    gridcolor="#ECEFF1",
    row=1, col=1
)
fig.update_yaxes(
    title_text="Overconsumption (% above post-dry dock baseline)",
    ticks="outside", ticklen=6, tickwidth=1.5,
    title_font=dict(size=AXIS_TITLE_SIZE),
    tickfont=dict(size=TICK_FONT_SIZE),
    showline=True, linewidth=1.5, linecolor="#9E9E9E",
    gridcolor="#ECEFF1",
    rangemode="tozero",
    row=1, col=1
)

fig.show()
Updated 10 months ago